Statistics can turn a simple list of numbers into a puzzle. A tiny change in one value can shift an average, reveal an outlier, or change the story a chart tells. These statistics riddles with answers use short clues about mean, median, mode, range, probability, graphs, samples, and data interpretation.
You will find easy statistics riddles for beginners, playful puzzles for kids, and harder challenges for students and adults. Each section contains 10 short riddles, with difficulty increasing as you move through the list.
Try solving each one before checking the answer. A calculator can help with arithmetic, but the best puzzles here are designed to make you think about what the numbers actually mean.
Easy Statistics Riddles for Beginners 📊
Riddle 1: I am the number found by adding all values and dividing by how many there are. What am I?
Answer: Mean
Riddle 2: I stand in the middle when data is put in order. What am I?
Answer: Median
Riddle 3: I am the value that appears most often. What am I?
Answer: Mode
Riddle 4: I show the distance between the largest and smallest values. What am I?
Answer: Range
Riddle 5: Five scores are 2, 4, 6, 8, and 10. What is their mean?
Answer: 6
Riddle 6: The numbers are 3, 5, 7, 9, and 11. What is the median?
Answer: 7
Riddle 7: In 2, 4, 4, 6, and 8, which number is the mode?
Answer: 4
Riddle 8: A list runs from 4 to 15. What is its range?
Answer: 11
Riddle 9: I can describe a group with one number, but I am not always the middle value. What am I?
Answer: Mean
Riddle 10: If every value in a dataset is 7, what is the mean?
Answer: 7
Mean and Average Statistics Riddles
Riddle 11: Three numbers are 5, 10, and 15. What is their average?
Answer: 10
Riddle 12: Four test scores average 80. Their total score is what?
Answer: 320
Riddle 13: Five numbers total 45. What is their mean?
Answer: 9
Riddle 14: I rise when a very large value joins the group. What statistic am I?
Answer: Mean
Riddle 15: Six numbers have a mean of 7. What is their total?
Answer: 42
Riddle 16: The average of 4, 6, and me is 8. What number am I?
Answer: 14
Riddle 17: A class has 10 students with an average age of 12. What is their combined age?
Answer: 120 years
Riddle 18: Add 5 to every value in a dataset. What happens to the mean?
Answer: It increases by 5
Riddle 19: Subtract 3 from every value. What happens to the mean?
Answer: It decreases by 3
Riddle 20: I am pulled strongly by unusually high or low values. Who am I?
Answer: Mean
Median and Mode Riddles
Riddle 21: Put 2, 5, 8, 10, and 12 in order. Which value sits in the middle?
Answer: 8
Riddle 22: Seven numbers are ordered. Which position is the median?
Answer: Fourth
Riddle 23: What is the median of 1, 3, 5, 7, and 9?
Answer: 5
Riddle 24: What is the median of 2, 4, 6, and 8?
Answer: 5
Riddle 25: I love repeated values. Find me in 3, 3, 4, 6, and 8.
Answer: 3
Riddle 26: A dataset has two values tied for most frequent. What is it called?
Answer: Bimodal
Riddle 27: What is the mode of 5, 7, 7, 8, 8, and 9?
Answer: 7 and 8
Riddle 28: If no value repeats, what can you say about the mode?
Answer: There is no mode
Riddle 29: For an even number of ordered values, how is the median found?
Answer: Average the two middle values
Riddle 30: I ignore most values and focus on the center of ordered data. Who am I?
Answer: Median
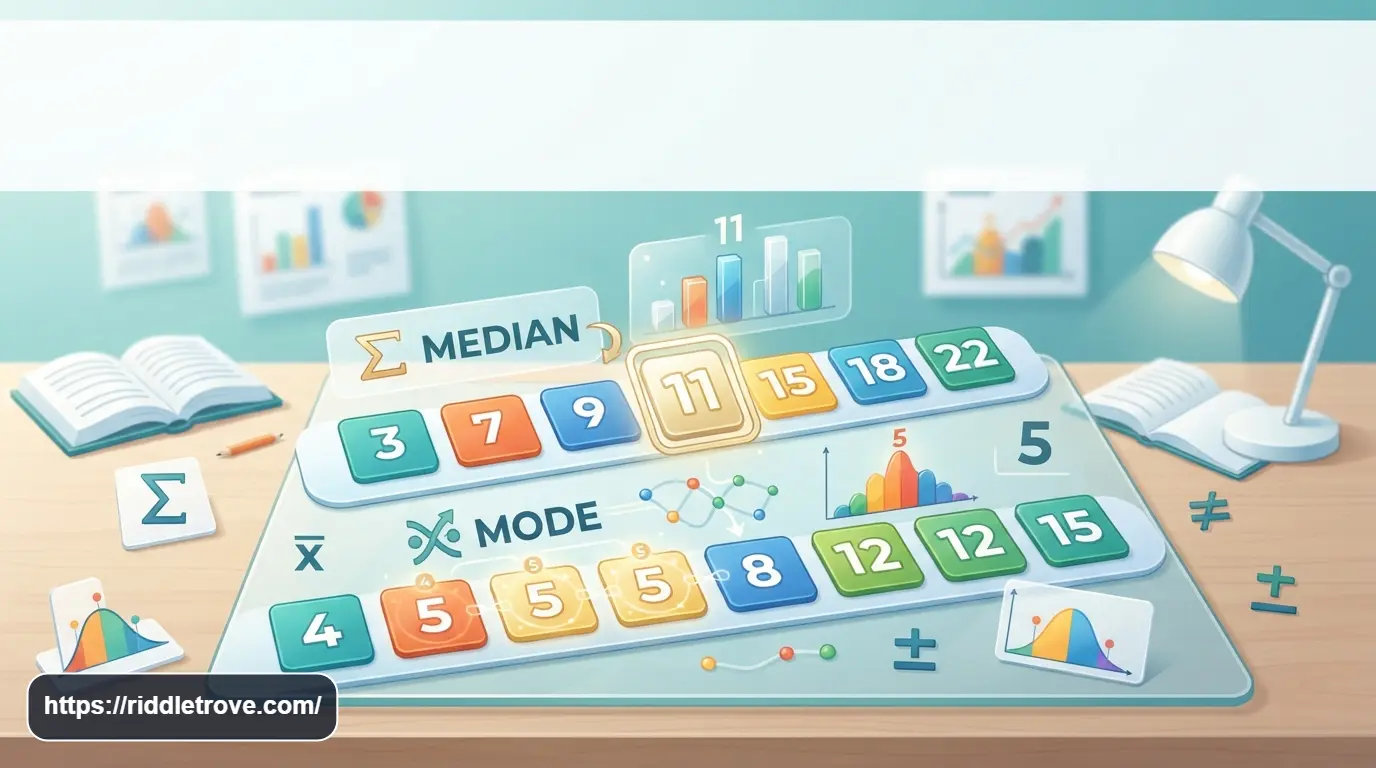
Range and Spread Riddles
Riddle 31: My smallest value is 4 and my largest is 19. What is my range?
Answer: 15
Riddle 32: Scores are 12, 15, 18, and 20. What is the range?
Answer: 8
Riddle 33: If the highest value is 30 and the lowest is 30, what is the range?
Answer: 0
Riddle 34: I tell you how far the data stretches from low to high. What am I?
Answer: Range
Riddle 35: A dataset changes from 6–10 to 6–25. What happened to its spread?
Answer: It increased
Riddle 36: Which dataset has the greater range: 2–8 or 10–30?
Answer: 10–30
Riddle 37: Values are 9, 9, 9, and 9. How wide is their range?
Answer: 0
Riddle 38: I am not the average, but I tell you about the distance between extremes. Who am I?
Answer: Range
Riddle 39: The range is 14 and the minimum is 3. What is the maximum?
Answer: 17
Riddle 40: The maximum is 25 and the range is 9. What is the minimum?
Answer: 16
Statistics Riddles for Kids
Riddle 41: Mia scores 4, 6, and 8. What is her average score?
Answer: 6
Riddle 42: Five pets weigh 2, 3, 3, 4, and 5 pounds. What is the mode?
Answer: 3
Riddle 43: Three friends have 2, 5, and 8 stickers. What is the median?
Answer: 5
Riddle 44: A spinner lands on blue 6 times out of 10. What fraction is blue?
Answer: 6/10
Riddle 45: A class has 20 students. Five wear glasses. What fraction wears glasses?
Answer: 1/4
Riddle 46: A toy box has 3 red, 4 blue, and 5 green balls. How many balls are there?
Answer: 12
Riddle 47: Scores are 7, 7, 8, 9, and 10. What is the mode?
Answer: 7
Riddle 48: I am a picture that uses bars to compare numbers. What am I?
Answer: Bar graph
Riddle 49: I show data with slices like pieces of a pie. What am I?
Answer: Pie chart
Riddle 50: I help you compare data without saying every number aloud. What am I?
Answer: A graph
95+Architecture Riddles With Answers
Data Interpretation Riddles
Riddle 51: A chart shows Monday at 8 and Tuesday at 12. Which day is higher?
Answer: Tuesday
Riddle 52: A graph rises from 10 to 20. What happened to the value?
Answer: It increased
Riddle 53: A graph falls from 18 to 11. What happened?
Answer: It decreased
Riddle 54: Four bars are 5, 9, 7, and 12. Which is tallest?
Answer: 12
Riddle 55: A line graph stays flat at 15. What does that suggest?
Answer: No change
Riddle 56: A pie chart gives half its circle to one category. What percentage is that?
Answer: 50%
Riddle 57: Three groups have 20, 30, and 50 items. Which group is largest?
Answer: The 50-item group
Riddle 58: A chart has 25 red items and 15 blue items. Which color has more?
Answer: Red
Riddle 59: A data line peaks at 40. What does the peak represent?
Answer: The highest value
Riddle 60: A chart falls steadily from left to right. What general trend does it show?
Answer: A decreasing trend
Funny Statistics Riddles 😄
Riddle 61: I wanted the average, but my extreme friend pulled me away. Who am I?
Answer: The mean
Riddle 62: I always stand in the middle. In statistics, that makes me the center of attention. Who am I?
Answer: Median
Riddle 63: I am the value everyone keeps repeating. What am I?
Answer: Mode
Riddle 64: I measure the distance between the smallest and biggest drama queens. What am I?
Answer: Range
Riddle 65: Why did the statistician bring a ladder to the graph?
Answer: To reach the higher values
Riddle 66: Why did the mean feel nervous around an outlier?
Answer: It knew the outlier could pull it away
Riddle 67: Why did the median stay calm?
Answer: It knew how to keep its position
Riddle 68: What does a statistician say when numbers tell the same story?
Answer: “That’s a consistent trend!”
Riddle 69: Why did the graph go to school?
Answer: To improve its data presentation
Riddle 70: What statistic never wants to be left out of a repeated-value party?
Answer: The mode
Probability and Statistics Riddles
Riddle 71: A fair coin is flipped once. What is the chance of heads?
Answer: 1/2
Riddle 72: A fair die has six sides. What is the chance of rolling a 6?
Answer: 1/6
Riddle 73: A bag has 3 red and 2 blue balls. What is the chance of red?
Answer: 3/5
Riddle 74: Two fair coins are flipped. What is the chance both are heads?
Answer: 1/4
Riddle 75: A die is rolled. What is the chance of an even number?
Answer: 1/2
Riddle 76: A deck has 52 cards. How many are hearts?
Answer: 13
Riddle 77: What is the probability of drawing an ace from a standard 52-card deck?
Answer: 1/13
Riddle 78: A spinner has four equal sections. One is green. What is the chance of green?
Answer: 1/4
Riddle 79: Ten equally likely outcomes have three winners. What is the probability of winning?
Answer: 3/10
Riddle 80: If an event cannot happen, what is its probability?
Answer: 0
Hard Statistics Riddles
Riddle 81: The mean of five numbers is 12. Four total 40. What is the fifth?
Answer: 20
Riddle 82: A dataset has mean 10. Add one value of 20. Will the new mean be higher or lower?
Answer: Higher
Riddle 83: A dataset has values 4, 6, 8, 10, and 100. Which statistic is least affected by 100?
Answer: Median
Riddle 84: The values are 2, 4, 6, 8, and 100. What is the median?
Answer: 6
Riddle 85: A dataset has a strong high outlier. Which center measure is usually more resistant?
Answer: Median
Riddle 86: Five numbers have a mean of 14. Four are 10, 12, 15, and 18. What is the fifth?
Answer: 15
Riddle 87: A dataset has mean 20. Every value is doubled. What is the new mean?
Answer: 40
Riddle 88: A dataset has mean 30. Every value is reduced by 10. What is the new mean?
Answer: 20
Riddle 89: A sample has 100 people, and 30 choose option A. What percentage chose A?
Answer: 30%
Riddle 90: A dataset has two modes. What is the distribution called?
Answer: Bimodal

Challenging Statistics Brain Teasers 🧠
Riddle 91: Three numbers have a mean of 18. Two are 12 and 20. What is the third?
Answer: 22
Riddle 92: Four numbers have a mean of 15. Three are 10, 12, and 18. What is the fourth?
Answer: 20
Riddle 93: A dataset has 8 values. Which position contains the upper median value?
Answer: Fifth
Riddle 94: A dataset has 8 ordered values. Which two positions determine its median?
Answer: Fourth and fifth
Riddle 95: The mean is 25 for six values. Their total must be what?
Answer: 150
Riddle 96: A class average is 70. One student scoring 100 joins the calculation. Does the average necessarily rise?
Answer: Yes, if the original average is below 100
Riddle 97: A dataset has values 5, 5, 5, 10, and 20. Which measure of center is 5?
Answer: Mode
Riddle 98: A dataset has values 2, 4, 6, 8, and 100. Which center measure is 6?
Answer: Median
Riddle 99: Every value in a dataset is identical. What is its range?
Answer: 0
Riddle 100: A dataset’s values are all increased by 7. Which statistic increases by exactly 7: mean, median, or both?
Answer: Both
Practical Ways to Use Statistics Riddles
These short puzzles can work as quick classroom warm-ups, math brain breaks, study activities, or family challenges. For younger learners, start with mean, median, mode, graphs, and simple data questions. Older students can move into outliers, probability, samples, and multi-step calculations.
A useful approach is to hide the answers and let solvers explain why they chose each one. That turns a quick riddle into a small lesson in statistical thinking.
Conclusion
Statistics riddles with answers can make concepts such as mean, median, mode, range, probability, and data interpretation much easier to practice. The best puzzles do more than ask for a calculation. They make you notice patterns, compare values, and think about what the data is really saying. Start with the easier riddles, then work toward the harder statistics brain teasers without checking the answers too quickly. A few minutes of solving can turn ordinary numbers into surprisingly clever puzzles.
Frequently Asked Questions
What are statistics riddles?
Statistics riddles are short puzzles based on statistical ideas such as averages, median, mode, range, probability, graphs, data patterns, and outliers.
Are statistics riddles good for kids?
Yes. Simple statistics riddles can introduce children to averages, data comparisons, graphs, and basic probability in a playful way.
What are the main topics in statistics riddles?
Common topics include mean, median, mode, range, probability, data interpretation, graphs, samples, percentages, and outliers.
Are these statistics riddles suitable for students?
Yes. The easier puzzles can work as classroom warm-ups, while the harder riddles provide extra practice with mathematical reasoning.
What is the difference between mean and median?
The mean is calculated by adding values and dividing by the number of values. The median is the middle value after the data is ordered.
What is the mode in statistics?
The mode is the value that appears most often in a dataset. A dataset can have one mode, multiple modes, or no mode.
Why are outliers important in statistics?
An unusually high or low value can affect statistics such as the mean and can change how a dataset appears.
Can statistics riddles be used as math brain teasers?
Yes. Short statistics puzzles can be used as brain breaks, review questions, classroom activities, or quick challenges for students and adults.